Demonstrate the principles of osmosis and diffusion using Indigo® glucose test strips. These strips help visualize concentration gradients, membrane permeability, and enzyme reactions in one easy lab.
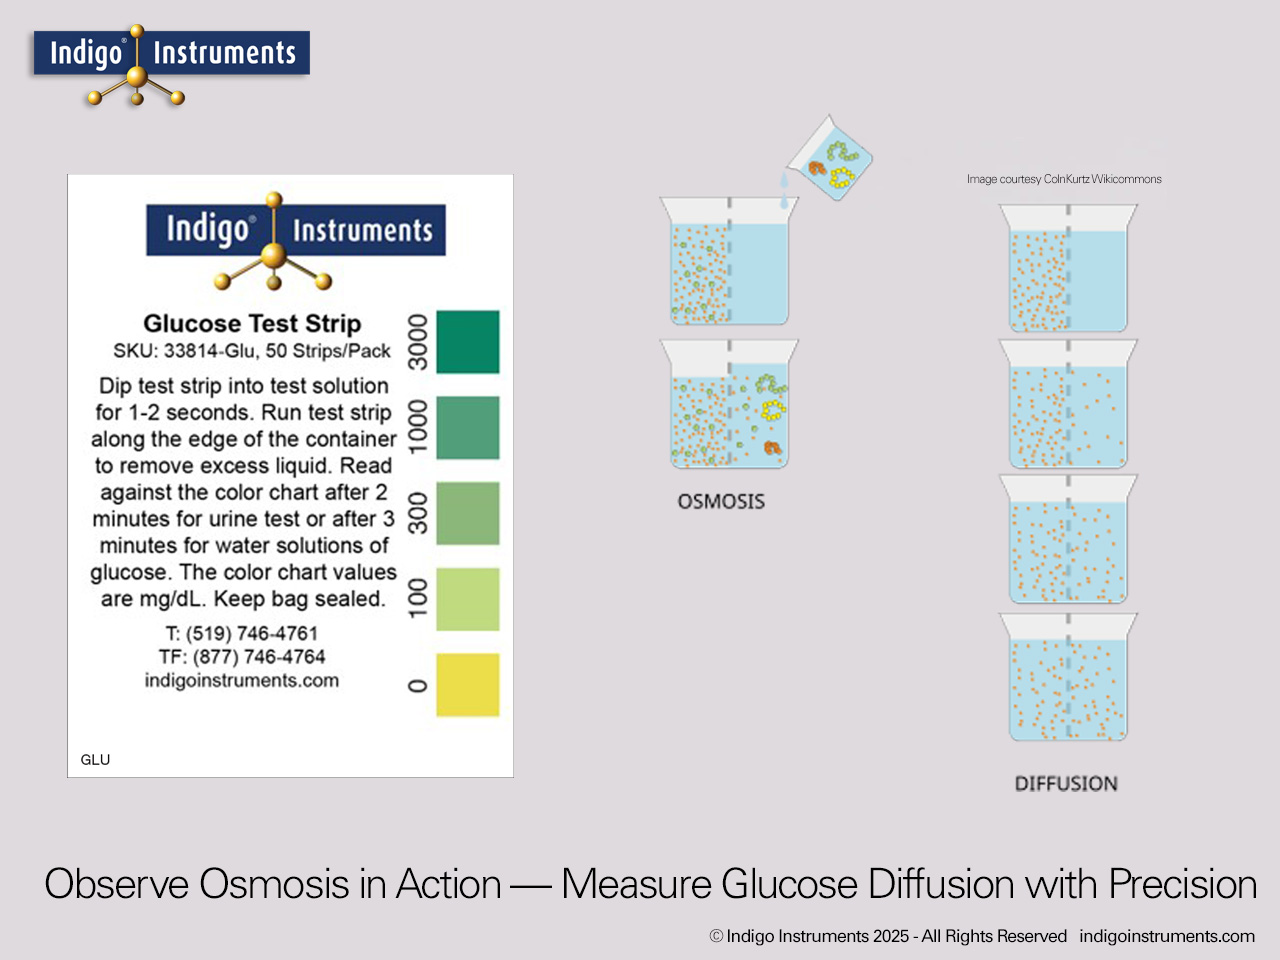
Osmosis and diffusion are fundamental to understanding how molecules move in living systems. Using glucose test strips, students can visualize how solute concentration gradients affect the movement of water and glucose across a semi-permeable membrane. By comparing glucose concentration inside and outside a dialysis tube before and after exposure, learners directly observe diffusion in action. The enzyme-based color change offers a quick, visual confirmation of molecular movement and concentration differences.
Bring osmosis and diffusion to life. Order Indigo® glucose test strips today and let your students see concentration gradients in real time.
| Concept | Description | Activity | Learning Link |
|---|---|---|---|
| Osmosis | Water moves from low to high solute concentration through a semi-permeable membrane. | Use glucose strips to detect concentration changes inside and outside the membrane. | Visualizes the driving force behind water movement in cells. |
| Diffusion | Glucose molecules move down their concentration gradient until equilibrium is reached. | Measure glucose before and after diffusion between solutions. | Illustrates molecular motion and equilibrium dynamics. |
| Concentration Gradient | The difference in solute levels determines rate and direction of molecular movement. | Test multiple concentration pairs and graph diffusion rate vs. gradient strength. | Links experimental observation to Fick’s laws of diffusion. |
Students can build 3D glucose models to visualize the molecule behind these diffusion and urinalysis experiments:
These hands-on models reinforce spatial understanding of glucose’s ring form and help explain why its size limits membrane permeability during osmosis. University students taking organic chemistry will also recognize that the cyclohexane chair-boat flip applies to glucose.
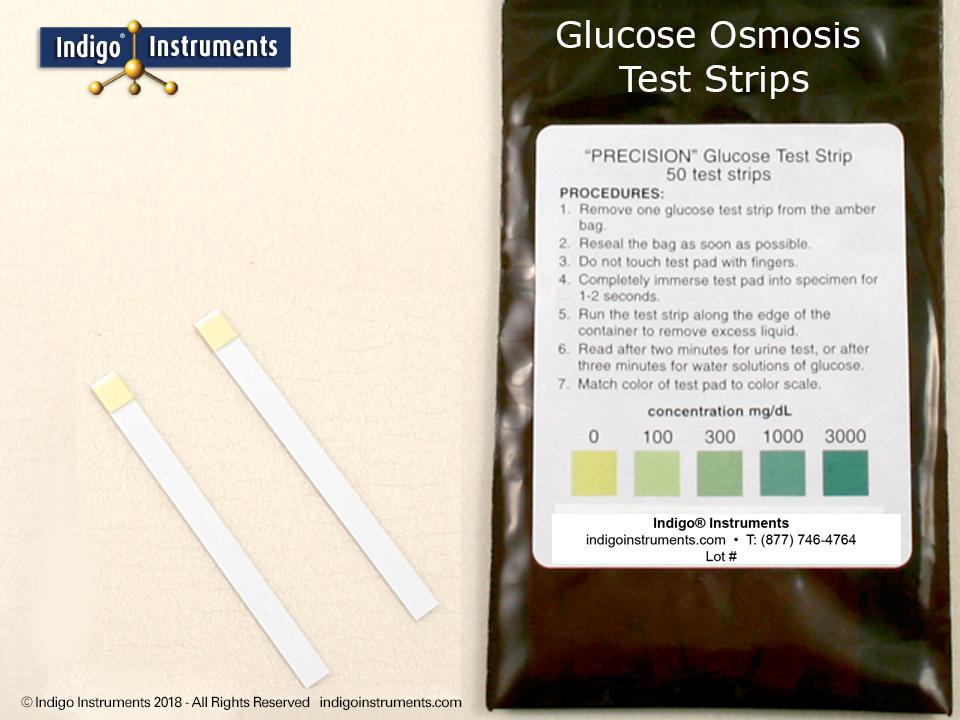
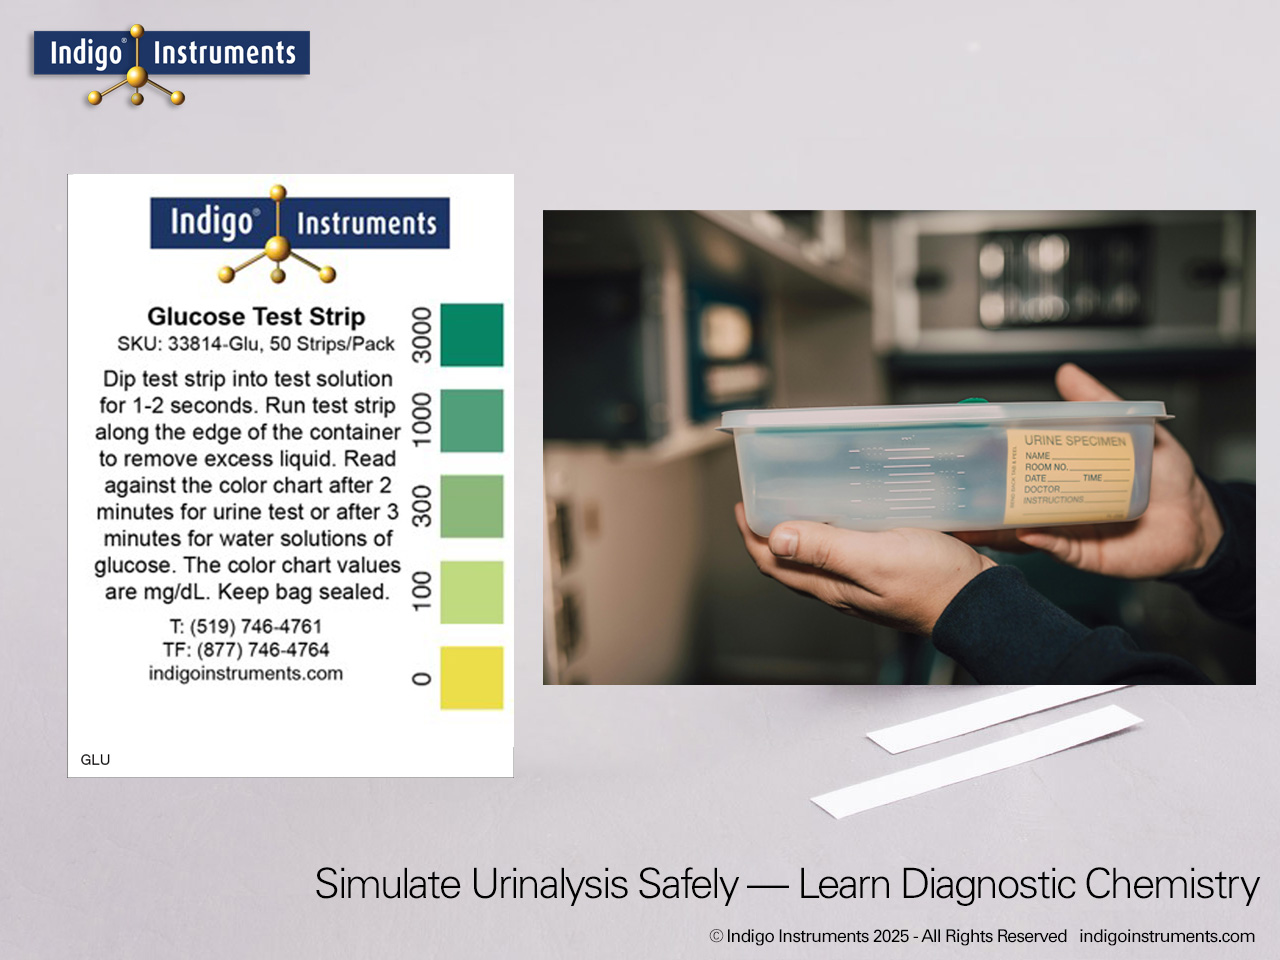
The color test chart indicates concentration levels in mg/dL but you can convert this to mmol/L by multiplying by 0.055. eg. 100mg/dL is equal to 5.5mmol/L.
These strips are not intended for medical diagnosis. Should you decide to test your urine & you get any positive result you should report it to your physician who can order a proper test for your blood sugar levels.